 Streamflow
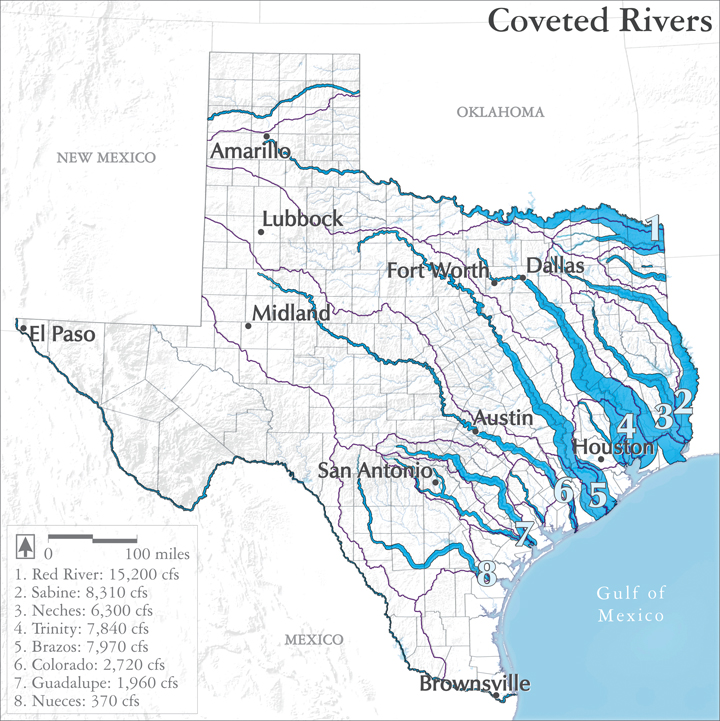
Most maps show all rivers as lines of equal width. That can be confusing, since an intermittent arroyo in the desert may appear to be as large as a mighty river flowing through rich bottomlands.
Here, we’ve made an effort to show how the actual flows of Texas rivers vary across the state: a wider stroke means a bigger median flow, while a narrow line means a smaller flow.
As you can see, the Sabine and Trinity and other eastern rivers carry big flows, while the rivers of west and south Texas, such as the Nueces and San Antonio, typically see much smaller amounts of water.
In this way, maybe the map will suggest how the state’s surface water is often distant from Texas’ thirsty centers of agriculture, industry and population, requiring hard decisions about how to balance those water demands with the ecological and community needs of the more well-watered areas of the state.
Map sources:
Asquith, William, Joseph Vrabel, Meghan Roussel. 2007. Summary of Annual Mean, Maximum, Minimum, and L-scale Statistics of Daily Mean Streamflow for 712 U.S. Geological Survey Streamflow-Gaging Stations in Texas Through 2003. Data Series 248. U.S. Geological Survey, U.S. Department of Interior. In cooperation with the Texas Commission on Environmental Quality. http://pubs.usgs.gov/ds/2007/248/ (Accessed October 29, 2014).
Bezanson, David. 2014. Texas Nature Conservancy. Personal communication. April 2014.
East, Jeffery. 2014. Surface Water Specialist, Texas Water Science Center. U.S. Geological Survey. Personal communication. October 2014.
U.S. Geological Survey. 2014. Current Conditions for Texas: Streamflow. National Water Information System: Web Interface. http://waterdata.usgs.gov/tx/nwis/current/?type=flow (Accessed April 11, 2014).
Wentzel, Mark. 2014. Instream Flows Team Leader, Surface Water Resources Division, Texas Water Development Board. Personal communication. October 2014.