Population
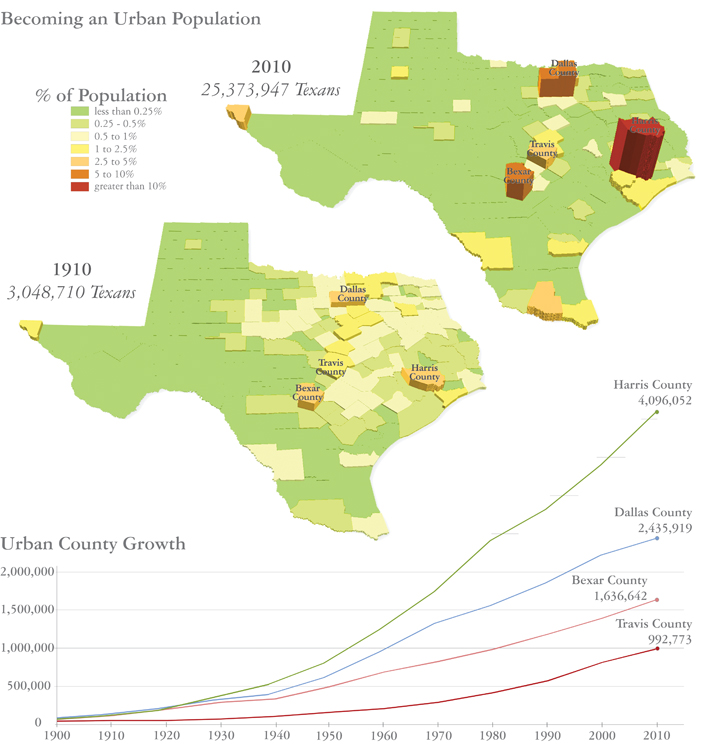
These maps show the rapid growth of Texas’ population, from barely 3 million in 1910, to over 25 million a century later. It also tracks the shift of the state from a rural population, congregated in the eastern portion of the state, to an urban state, with booming towns in the Houston region, along the I-35 Corridor, and in the Rio Grande valley.
Overall population growth in the state has a clear tie with environmental impacts. Having more residents translates into greater consumption of land, energy, water, and all sorts of consumer goods, and into larger discharges of wastewater, air emissions, solid waste, and surface runoff. This is particularly true in our developed, consumer-driven economy.
And, the shifts of population within the state have a role to play in the environment as well, since people are moving away from where resources may be coming from (imagine water supplies or food), requiring extra energy and infrastructure to convey them to the end users. Finally, concentrating more people in a limited area can overcome the ability of local watersheds, airsheds, and physical plant to treat and absorb the waste that is generated.
Map Sources:
Texas Almanac. 2013. Texas Almanac: Population History of Counties from 1850 – 2010. http://www.texasalmanac.com/sites/default/files/images/topics/ctypophistweb2010.pdf (Accessed April 28, 2013).
Texas State Library and Archives Commission. 2013. United States and Texas Populations, 1850-2012. https://www.tsl.state.tx.us/ref/abouttx/census.html (Accessed April 28, 2013).